Finding
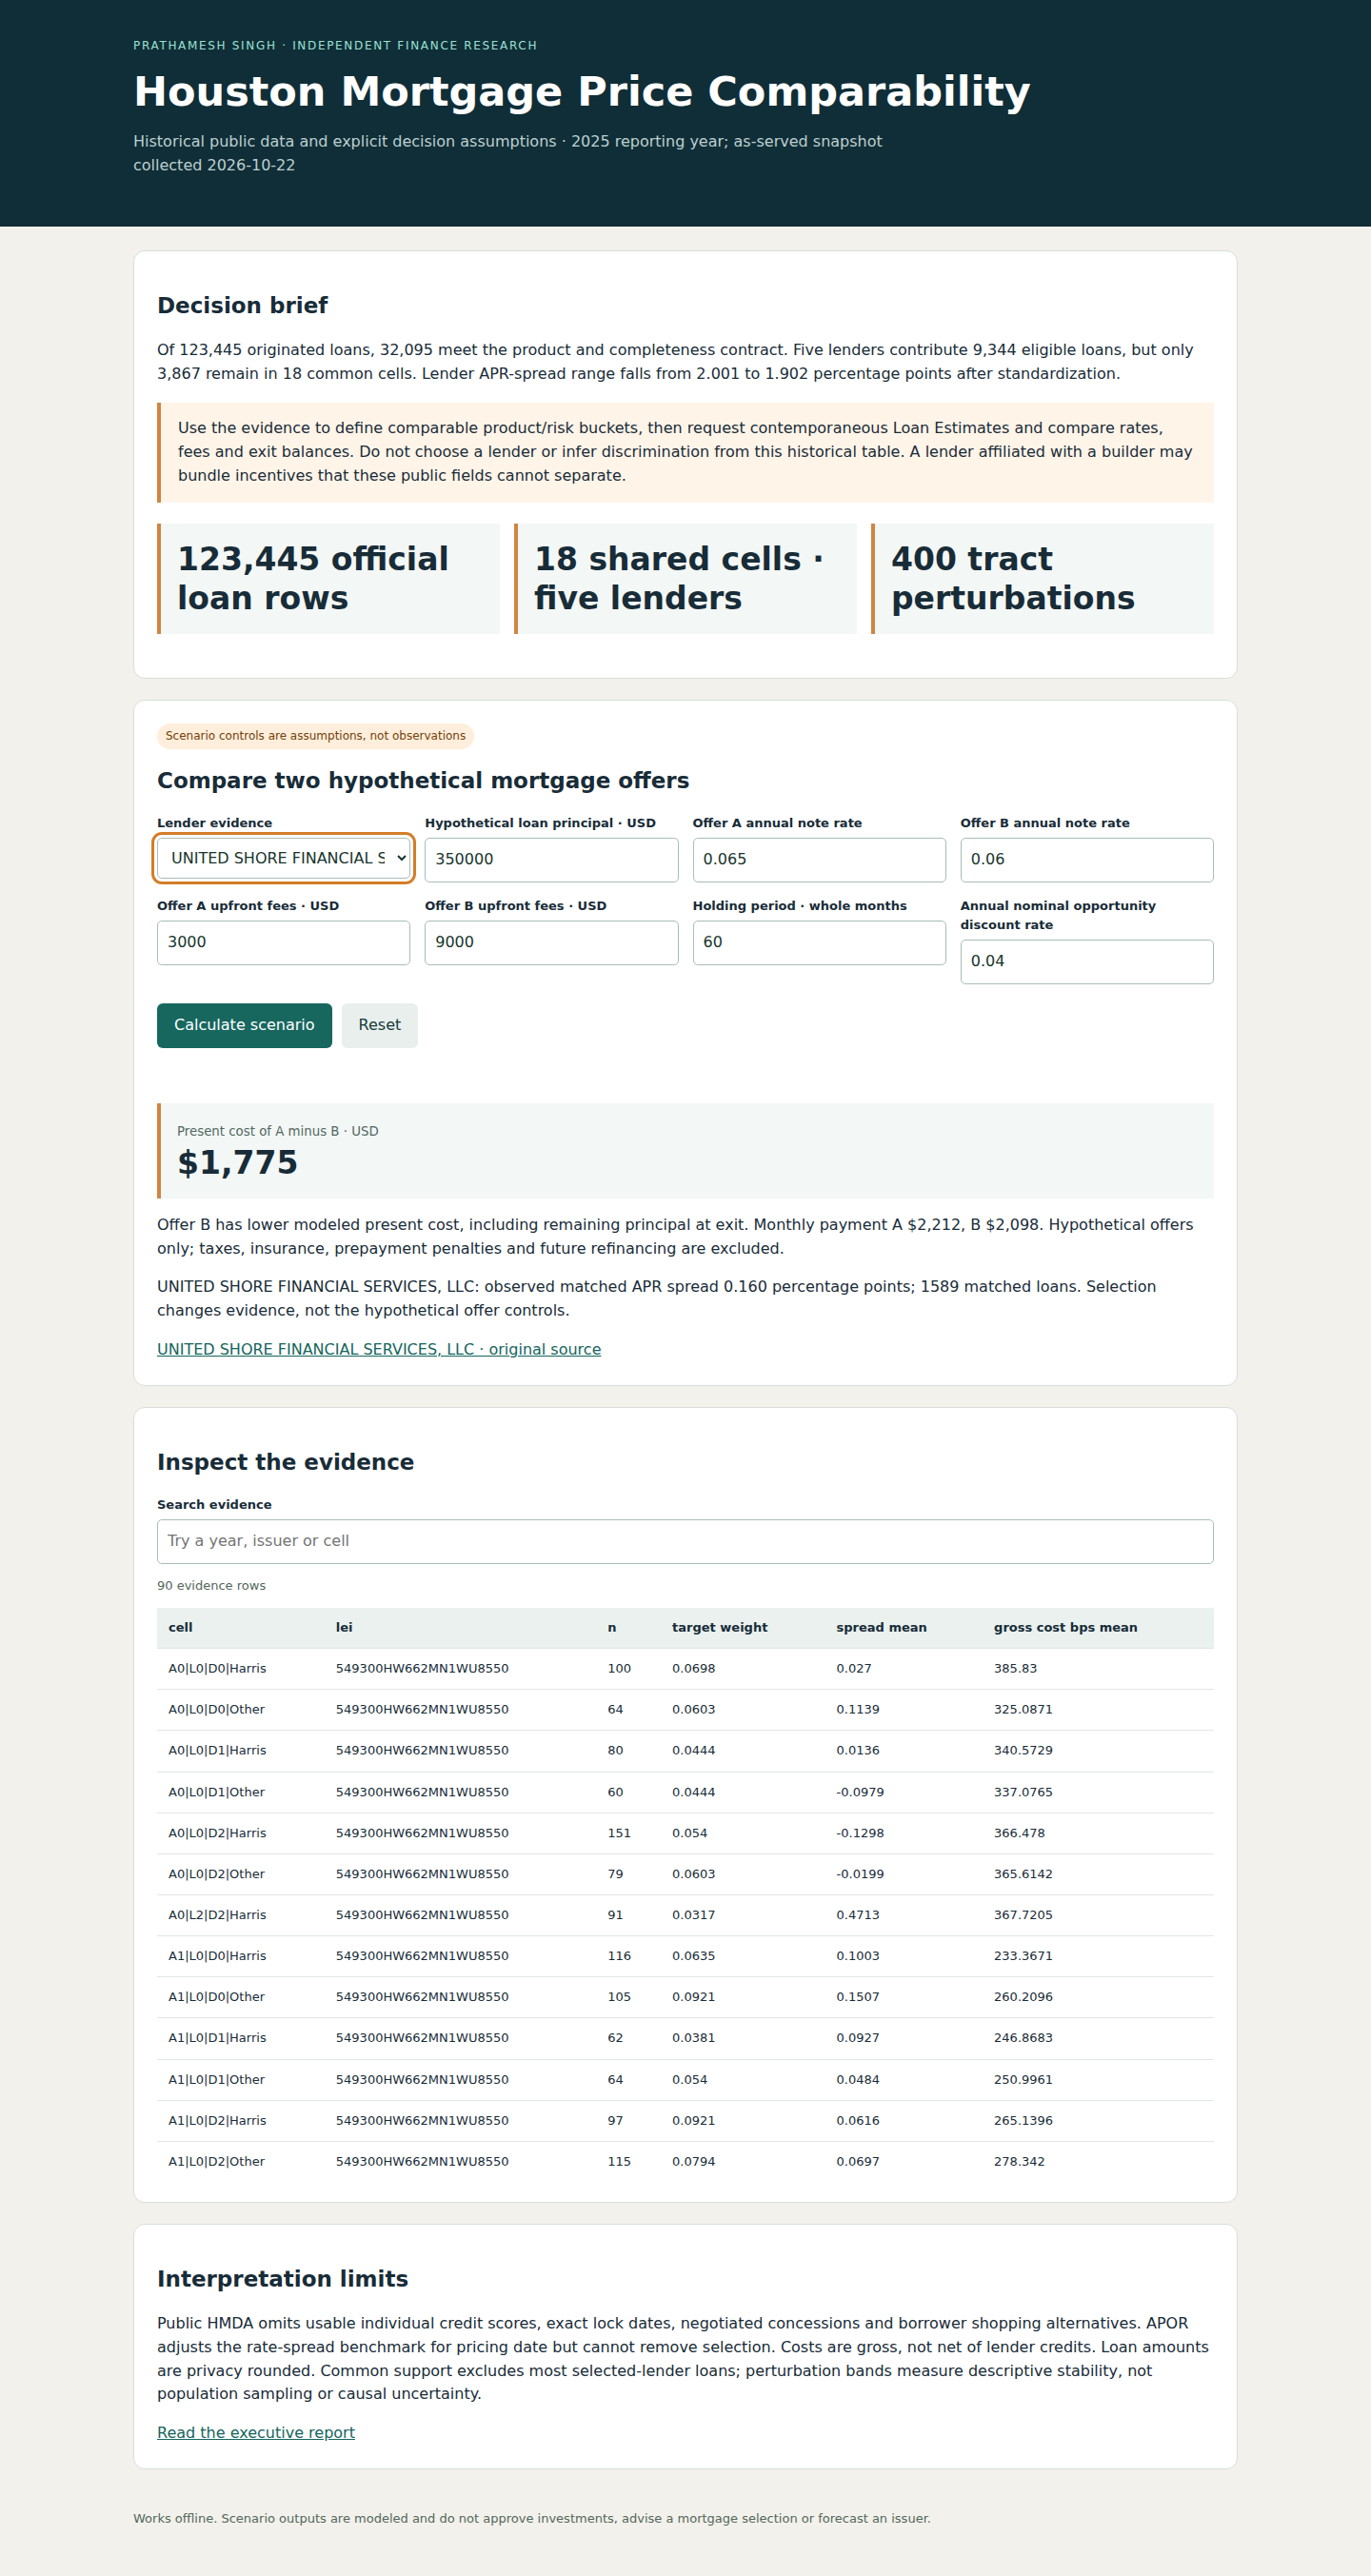
The five selected lenders have 9,344 eligible loans. Of those, 3,867 fall in 18 borrower/loan groups represented at every lender, retaining 41.38%. The observed price-spread range changes from 2.001 to 1.902 percentage points after matching. The remaining gap is descriptive.
Why it matters
Check which borrowers a comparison represents before ranking lender averages. For a borrower decision, request dated Loan Estimates for the same product and review rates, fees, credits and holding period.
Who could use this
Consumer-finance researchers deciding which historical lender-price comparisons have observable common support.
Data and scope
123,445 public Houston-area HMDA originated loans from the pinned 2025 vintage. Product and completeness checks retain 32,095 eligible observations.
How the analysis works
The five largest eligible lenders are selected by counts before inspecting prices. Coarsened matching uses public loan, leverage, debt-to-income and geography bands; 400 tract perturbations examine descriptive stability.
Limits of the evidence
Missing credit scores, incentives, channels and shopping behavior leave hidden selection. Remaining differences are descriptive, not lender effects or current offers. Workbench rates, fees and holding periods are hypothetical.